
Essentially, an abstract representation of a financial situation, financial modeling has many uses, especially in decision-making and financial analysis. Many investors are no longer interested in just the “bottom-line potential” of a company, and financial modeling can help them to assess a company’s potential liability should the assumptions that drove the financial model change.
The Need for Financial Modeling
Financial modeling can also be used to make decisions about acquisitions, raising or allocating capital, budgeting, and forecasting, or valuing a business.
Driven by assumptions, sound financial modeling can dictate financing strategies and timelines, returns on investment, business Net Present Value analysis, and cash flow break even timelines by plausibly laying out scenarios and outcomes, and enabling sensitivity analysis and “what-if” testing on all variables within the financial model.
Financial modeling is supported by Capital Expenditure Summaries, Sensitivity Analysis, and Scenario Planning, Revenue Assumptions, Hiring and Salary Schedules, Depreciation Summaries, Leverage and Loan Impact, Investment Modeling, Investment Analysis/ROI/IRR, Departmental Expense Assumptions and Cash Flow Assumptions and can provide GAAP compliant financial statements including Balance Sheets, Income Statements, and Statements of Cash Flows.
What Financial Modeling Can Achieve
Financial modeling assists in the decision-making process and can be used by investors or financial analysts to achieve a multitude of goals, from cash flow forecasting and management and board reporting to strategic planning and options analysis.
Financial models serve as a useful tool in various business situations:
CFO Office
- Budgeting and management forecasting
- Cash and working capital management
- Strategic planning and forecasting
- Cash flow forecasting
- Management and board reporting
Decision Support
- Investment appraisal
- Product and customer profitability
- Strategic options analysis
- Valuation
- Pricing
Deal Modelling
- Improving a company’s positioning with finance providers
- Adding credibility to the business growth story
- Supporting creditor and bank negotiations
List of the Industries that Require Financial Modeling
Financial Modeling for Banking and Insurance Industry
Financial modeling objectives for the banking and insurance industries include Business Models, Accounting, and Valuation.
Challenges that Financial Institutions Can Get Rid of Through Financial Modeling
Because banks and insurance are able to generate money with the interest rate spread, EBITDA is no longer useful. Interest is a critical component of expenses and revenue. Balance sheets are required to project loans and deposits rather than unit sales and prices.
To adjust for this challenge, the following steps must be followed:
- Project how the company’s loans and deposits change over time. All other balance sheet items need to be linked to those figures.
- Assign interest rates to the interest-earning items and interest-bearing items.
- Use these rates to determine the interest income and expenses on the income statement, and estimate the non-interest revenue and expenses with percentage growth rates or by linking them to the relevant items.
Concepts like “working capital” and “free cash flow” are not applicable because interest, investments, and debt are related to a company’s core operations. Separating operating and financing activities is almost impossible.
Rather than a traditional DCF, employ the dividend discount model (DDM). This will use a firm’s dividends as a stand-in for cash flow.
To set up a DDM for a financial institution:
- Depending on the financial institution in question, assume a percentage growth in assets/loans or premiums.
- Next, assume a minimum regulatory capital ratio and work out how much shareholders’ equity will be required to meet this expectation each year.
- Based on the Cost of Equity, discount the dividends each year, then sum up those discounted values.
- Calculate the terminal value and discount that to the present value also using the Cost of Equity.
- Add the present value of the dividends and terminal value.
Enterprise Value cannot be calculated, so Equity Value automatically becomes more important.
Analysts rely on the Excess Return Model, which arrives at the value of equity as the sum of the current equity capital and the present value of expected excess returns to equity.
Types of Financial Modeling Used in Banking and Finance Industry
- The change in the company’s loans and deposits over time must be calculated.
- Interest rates must be assigned to the interest-earning items and interest-bearing items.
- Those rates are used to determine the interest income and interest expense on the income statement.
- A cash flow statement is created once the income statement and balance sheet are completed.
- Balance SheetSeparated into assets and liabilities and shareholders’ equity, but with More Asset Classes, Gross Loans, Allowance for Loan Losses, and Net Loans, as well as More Liabilities.
- Income StatementSplit into non-interest revenue and expenses, and interest revenue and expenses.
Business Scenarios and Financial Model Case Studies
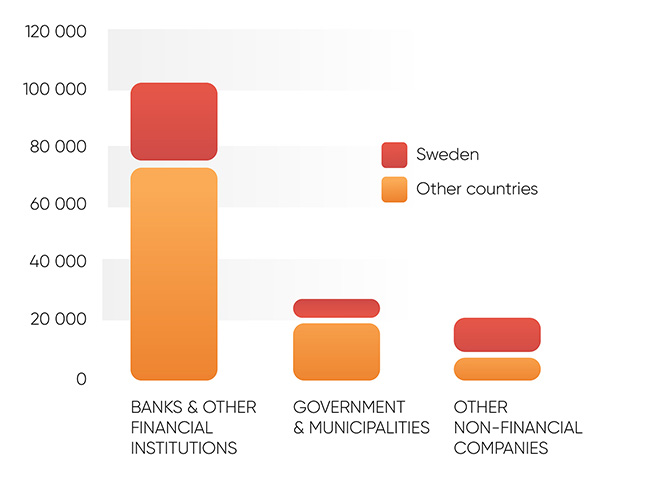
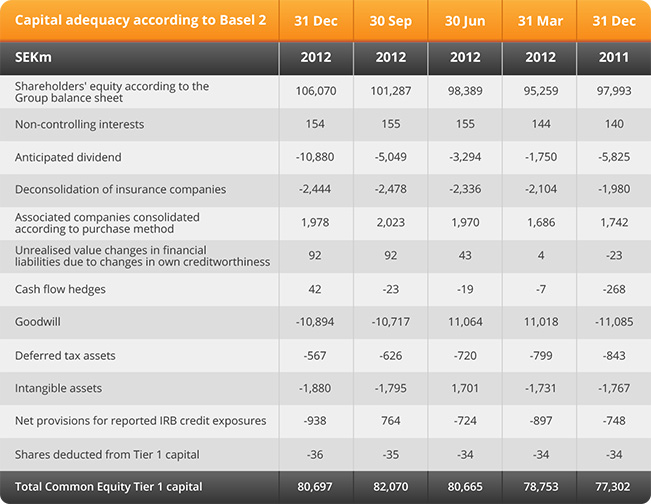
Macroeconomics Analysis by Swedish Bank

Swedbank offers a wide range of financial products and services to both individual households and businesses. Their traditional banking model is centered around solid customer relationships and trustworthy advisory services.
The case study covers (but is not limited to) macroeconomic analysis, income analysis, asset management, capital adequacy, and sensitivity analysis.
Key takeaways from this study include:
-
Interest-bearing assets between 2.91% and 3.31% over the course a 2 year period (2010-2012)
-
At the time of analysis, interest bearing liabilities were at 1.81%, the lowest point in the 2 year period of the case study (2010-2012)
-
At the time of analysis, the Net interest margin was at the highest point of the time period, 1.15%
Financial Modeling for Oil & Gas Industry
Financial modeling for the oil and gas industries includes business models, accounting, and valuation models. Other important objectives include showing how the Standard DCF Analysis translates into a Net Asset Value (NAV) Model and how to build a Net Asset Value (NAV), Model.
Challenges that Oil and Gas Industry Can Overcome Through Financial Modeling
Revenue modeling is tricky in the oil and gas industries as prices and revenue are controlled by “the market” and follow commodity price cycles.
A simple solution to this is using scenarios in Excel – creating a high, middle and low scenario with different expected prices, which allows for a range of possible outcomes for a company based on commodity prices.
Financial modeling for the oil and gas industries is balance sheet-centric, with the balance sheet containing the reserves that will generate future revenue and profit.
Rather than using EBITDA or revenue, companies and transactions might be picked based on Proved Reserves or Production volume. Other important metrics include the R / P Ratio (Proved Reserves / Annual Production), the % Proved Reserves in their Total Reserves, and the % Oil Mix.
Assets decline as revenue increases, because valuable resources are depleted as they are sold, and the Net Asset Value (NAV) model flips DCF on its head as perpetual growth is no longer assumed.
Rather, the assumption is that the company adds nothing to its reserves and will produce at 100% until it completely runs out of naturally occurring resources
For the Net Asset Value (NAV) model, the beginning and ending reserves each year must be tracked, along with the annual production volume, and the average price for each commodity.
Types of Financial Modeling Used in Oil & Gas Industry
- Valuation of Oil and Gas Projects
- Oil and Gas Tax Regimes Models: concessionary, services contracts and production sharing
- Petroleum Resource Rent Tax Modelling (PRRT)
- Production Sharing Contracts (PSC)
- Economic Limit and Payback Time
- Depreciation Modelling: straight-line, declining and units of production
Business Scenarios – Financial Modeling in Oil & Gas Industry
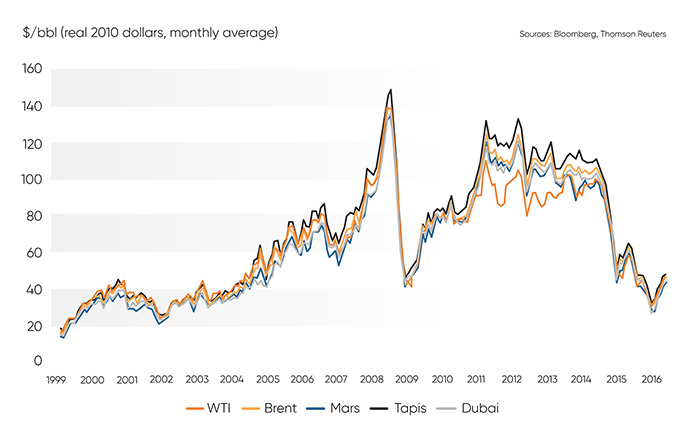
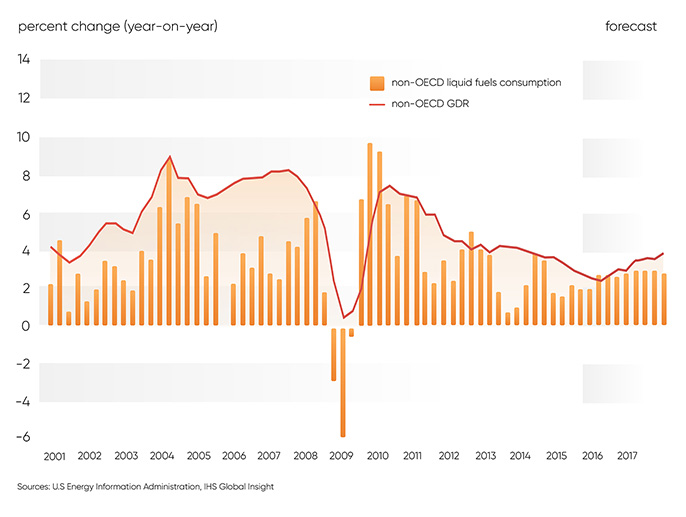
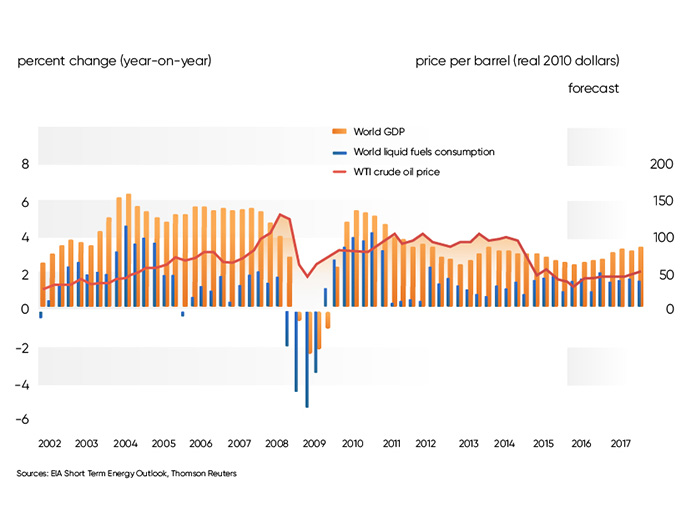
- Econometric Modeling for Oil Price Forecasting
In this sample study, OLS regression analysis is used to build a fairly simple model that can estimate the price of crude oil. Data has been collected from 1965 through the current point in 2016 from the following: consumption and OPEC and non-OPEC production (measured in millions of barrels per day), 10-year Treasury yields, US inflation, WTI price per barrel (averaged over the given year), US real GDP growth, OPEC inventory builds measured year-over-year, OPEC and non-OPEC reserves, and certain ratios of those variables.
Key takeaways from this case study:
- Price was modeled by an variable mix of consumption, production, ratio of consumption-to-production, year-over-year real GDP growth, and year-over-year OPEC inventory builds.
- Oil would be priced at roughly $65 a barrel, if OPEC inventory builds remain elevated to the tune of around 200 million barrels over their point last year and consumption and production came in around 96.3 million barrels per day.
- At 250 million barrels of year-over-year inventory builds, that would estimate the price of oil at about $57 per barrel. Finally, 300 hundred million barrels of year-over-year inventory build would estimate around $49 per barrel.
Financial Modeling for Extractive Industries
Financial modeling is used in extractive industries by companies, sponsors, and investors to assess the financial feasibility of various scenarios. This includes technical, operational, market-related and regulatory situations. Based on variations on input, the models assess variations in output.
What Financial Modeling to Offer for Extractive Industries
Estimates in financial modeling for extractive industries rely on accurate and extensive data, but this data is not often easy to attain.
Information on expenses such as capital cost are the most difficult to attain, possibly because of poor geological information and the difficulty in monitoring extractive operations.
Compensate for data gaps by using open data from accepted sources such as:
- CORPORATE FILINGS
Publicly listed companies obligated (by law) to supply data on their activities to investors through the exchanges where they are listed.
- BENCHMARKS
These heavily traded commodities have become the accepted standards against which the type and quality of commodities, as well as prices, are measured.
e.g.The three primary benchmarks that serve in the world’s crude markets are West Texas Intermediate (WTI), Brent Crude, and Dubai Crude.
Estimates of capital costs vary from high‐level estimates to comprehensive estimates including contingencies and allowances. The model should:
- Outline the method used to estimate capital costs. This will typically include indirect costs, contingencies, allowances, etc.
- The accuracy and confidence in the estimate increases as the project moves forward through the various conceptual, scoping, pre-feasibility, feasibility, and engineering study stages.
Types of Financial Modeling Used in Extractive Industry
-
DCF Modelling, comparable transactions or appraised value method.
-
Analysis of Risk and Uncertainty.
-
Project Finance and the Cost of Equity.
Financial Modeling for Real Estate Investment Industries
The objective in financial modeling in the Real Estate Investment Trust (REIT) industry is to link individual properties and REITs and project a REIT’s Income Statement, as well as detailed build-up by internal growth, new development, acquisitions, and dispositions.
Real Estate Investment Industry Challenges and Financial Modeling
01
Because different assumptions must be made in various phases of the project, timing becomes far more important.
Once the total costs have been figured out, the construction must be split into pre-construction, construction, and post-construction phases, each of which may last anywhere from 1-2 years (divided into months in your model) depending on the complexity of the development:
- Pre-Construction: During this phase, land acquisition costs and various other soft costs (legal fees, permits, etc.) are taken into consideration.
- Construction: Many of the hard costs are incurred here here, along with a few continued soft costs, as well as the initial payments for FF&E and TI expenses.
- Post-Construction: Soft costs continue to be a prominent expense once the building is constructed as well as additional FF&E and TI expenses.
- Once there is a rough sketch for the total development costs for each month in the timeline, it is necessary to begin thinking about revenue, operating expenses, and property taxes.
02
Different types of debt and equity are used, and because interest is capitalized while the property is under construction, the total funding required is often much higher than expected.
Use the Loan-to-Cost (LTC) Ratio from similar developments in the market to figure out what percentages of debt and equity makes sense.
Start off with the assumption that the total debt and equity required equals the Hard Costs + Soft Costs + Land Acquisition Costs + FF&E + TIs.
It is also necessary to add in capitalized interest and the operating deficit (i.e. how much the property loses before it starts turning a profit) to the total funds required.
03
Key assumptions and growth drivers on the Cash Flow Statement must be quantified, including the need for a REIT to constantly issue equity to replenish its capital structure:
Funds from Operations (FFO): Net Income + Depreciation & Amortization + Losses on Asset Sales – Gains on Asset Sales.
Adjusted Funds from Operations (AFFO): FFO – Maintenance CapEx + Other Adjustments.
With FFO, you are approximating how much the REIT can actually issue in dividends on a recurring basis from year to year.
D&A is always non-cash and does not affect its dividend-issuing capacity, so you add it back; losses and gains are assumed to be non-recurring, so you also exclude those.
The only issue with FFO is that you’re not taking into account the CapEx required to maintain all your properties, which is why AFFO exists.
Many analysts argue that AFFO better represents how much in potential dividends a REIT can issue on an ongoing basis, because they must maintain their properties no matter what else they do.
Types of Financial Modeling Used
Business models, valuations and typical profit margins differ for each segment.
Acquisitions & New Developments
- Future projected acquisition volume is modeled based on historical trends.
- Future projected development starts and completions are modeled.
- NOI, margins, revenue and expenses are modeled.
- Associated estimated depreciation expense is calculated.
- Net change to real estate assets is calculated.
Income Statement
- Acquisitions, dispositions and development figures are consolidated into revenue drivers.
- Distinguish between existing and new rental revenue and growth rate logic.
- The importance of applying assumed cap rates to new volume must be understood.
- Revenue and NOI including rental revenue and real estate expenses must be calculated.
- Total expenses must be calculated down to EBITDA, Net Income, FFO, NOI and EPS.
Balance Sheet, Cash Flow Statement and Sweep
- Key drivers of growth must be understood for Balance Sheet line items.
- The importance of applying assumed cap rates to new volume must be understood.
- CFO including working capital, CFI and CFF items specific to REITs must be calculated.
- A detailed build-up of dividends, shares outstanding and share issuances must be constructed.
- A simplified cash flow sweep must be built to capture any shortfalls or build-up in cash to balance the entire model and the use of debt as the ultimate balancer.
- Interest calculation must be incorporated to fully integrate the model.
Financial Modeling Case Studies – Real Estate Investment Industry
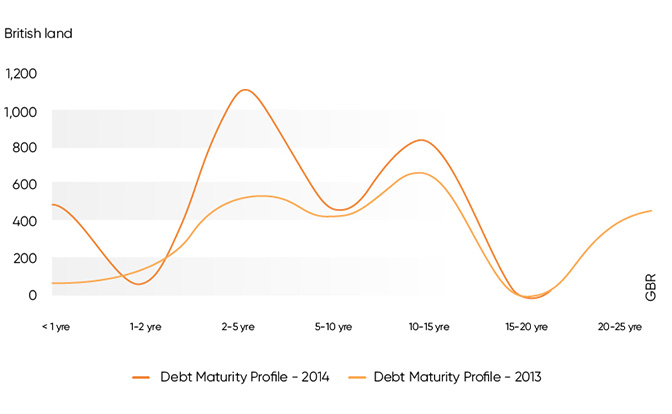
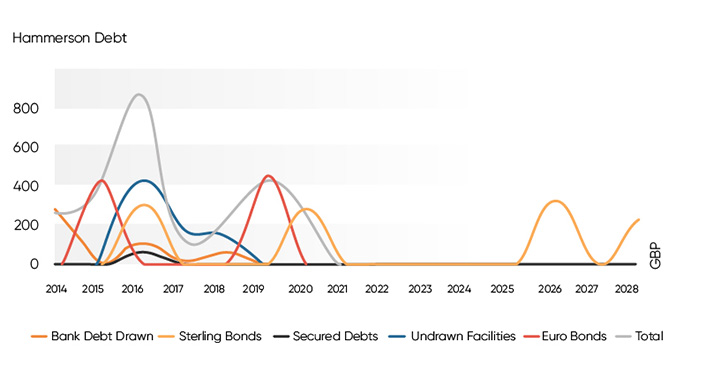
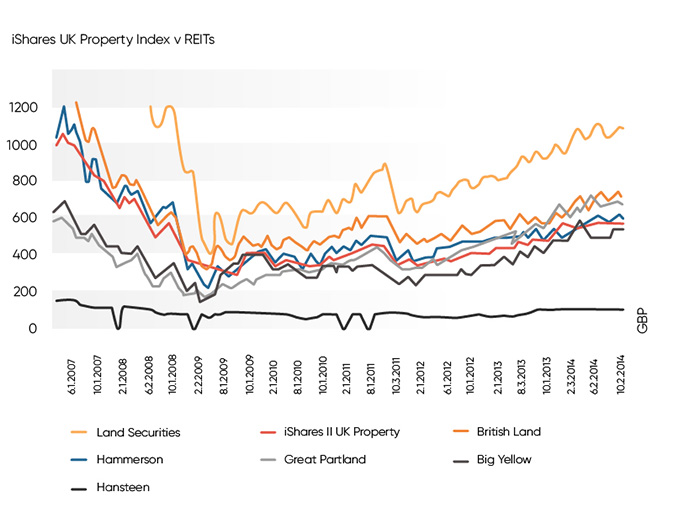
REIT Valuation Methods and Analysis
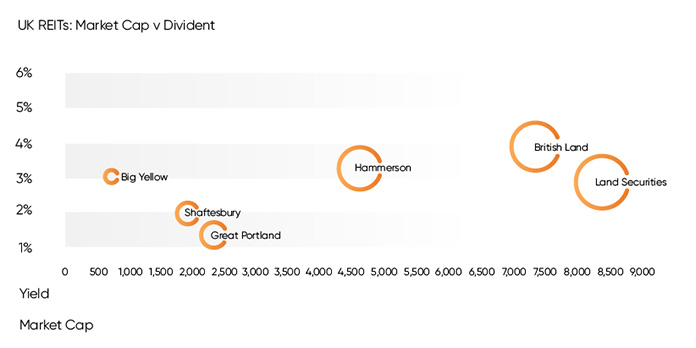
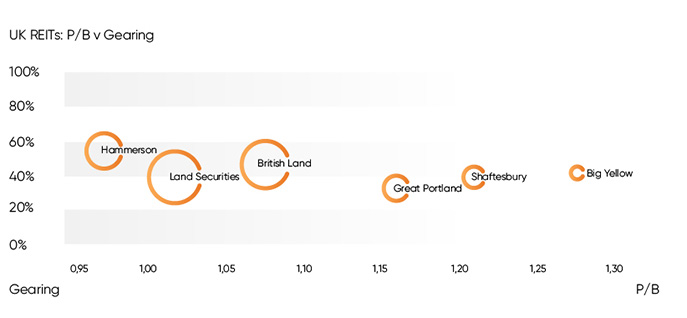
Because the UK introduced REIT legislation at the beginning of 2007 with eight listings, only a few REITs have long enough dividend histories as REITs for detailed analysis. Most UK-based companies pay dividends twice a year in a ratio of approximately 40%/60%. This makes analysis of the most recent dividend fairly challenging.
- Data from Bloomberg and Yahoo Financial data (October 2014) has been used
- Case study identifies three core ways of valuing REITs:
- Analyzing dividends retrospectively.
- Projecting dividends’ growth going forward.
- Looking at the accounts — i.e., capitalizing the net operating income.
4 analyses have been completed (2 for the first approach, one for the second, one for the third) – in the file there’s info on the actual steps of each analysis.
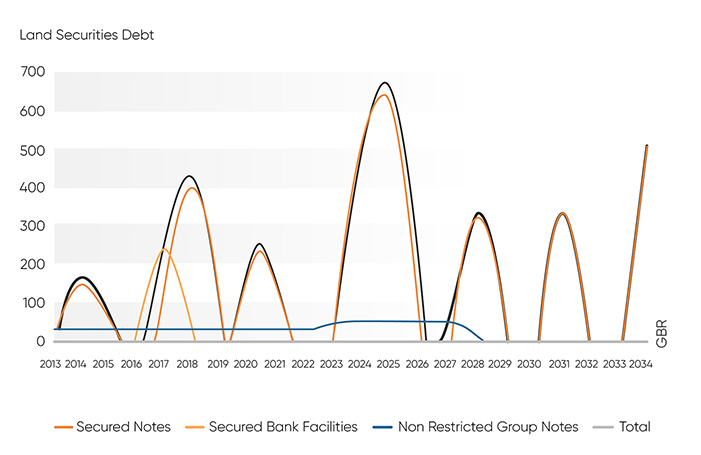
The most interesting investment opportunity has been identified (British Land in this case), with Hammerson, Big Yellow and Hansteen also worthy of more detailed research.
Financial Modeling for Retail Industry
In the retail industry, financial modeling is used for financial analysis and decision making and represents various aspects of the company’s stability. Financial modeling in the retail industry can be used for independent retailers, franchises, and member networks.
Financial Modeling to Overcome Challenges in Retail Industry
Inventory management is key in retail financial modeling, and models can be used to show inventory needed about turnover time. Profit margins can be thin as retail is a highly competitive industry, with minimal differentiation – outside of delivery times and customer service – and financial models can be used to demonstrate necessary bottom line and investment justification. Compensation plans should also be included.
01
Retailers can use financial modeling to define how they want to purchase and pay for the inventory necessary to fulfill forecasted product sales, based on drivers such as:
- How many months you want to keep each product in inventory, based on a forward-looking forecast of sales
- How many months it takes from placing a purchase order to being ready to sell (helping you forecast when to make purchases and maintain adequate inventory levels)
- What percentage of the cost to purchase inventory you are required to pay at the time of placing a purchase order
- How many days payable you have for the remainder of the unpaid inventory costs
02
Other Business challenges in Retail include identifying the right price and discount point that maximizes sales lift and return on investment (ROI) as well as optimizing promotions to improve the sales performance of newly launched products.
Modeling solutions and results include:
- Building a linear regression model to understand the impact of demand drivers on historical sales volume and calculate base volume.
- Calculating the total ‘true’ cost of promotions based on the individual components.
- Calculating ROI for historical promo events.
Types of Financial Modeling Used for the Retail Industry
Comparing the financial metrics of a company against other, similar businesses by calculating the valuation multiples – including customers, distribution channels, sectors, geography and products and services – and comparing them amongst the peer group.
Discounted Cash Flow (DCF) valuation is one of the most popular types of financial models, calculating the weighted average cost of capital, revealing the weighted average of a retailer’s cost of debt and cost of equity.
The following financial models can also be used for retail in certain cases
- Option Pricing Model
- Three Statement Model
- Forecasting Model
- Leveraged Buyout (LBO) Model
- Option Pricing Model
- Merger Model (M&A)
- Discounted Cash Flow (DCF) Model
- Initial Public Offering (IPO) Model
- Some of the Parts Model
- Consolidation Model
- Budget Model
Financial Modeling Case Studies for Retail Industry
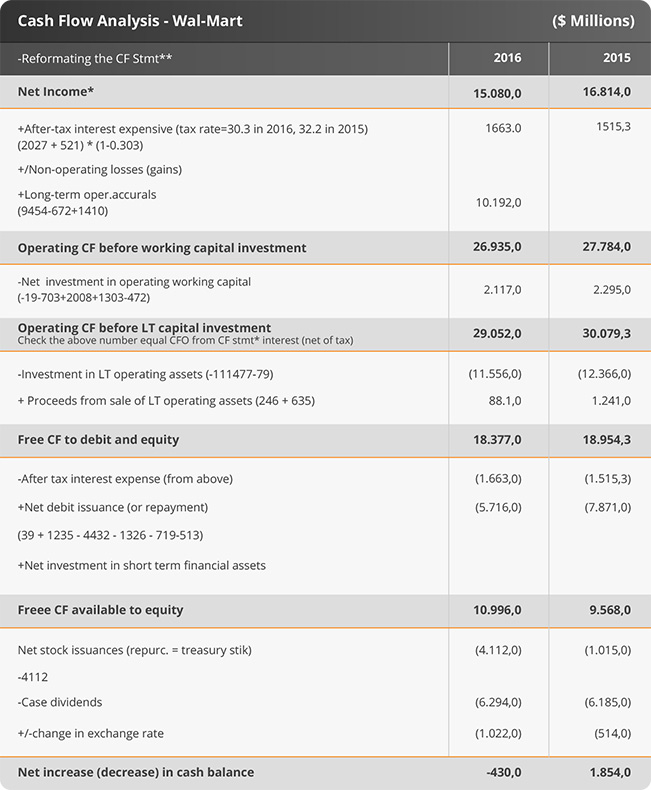
Application of Discounted Cash Flow Model Valuation – Wal-Mart (Academic paper)
This research paper examines whether DCF models offer reliable and accurate valuations of Wal-Mart. A thorough combination between theory and practice was implemented throughout the valuation.
- In 2016 WMT generated an impressive $29.1 billion in cash from operations. Their positive cash flow from working capital helps ensure WMT can meet short-term debt and upcoming operational expenses.
- WMT invested significantly in growth in 2016, with CAPEX of $11.6bn being larger than depreciation expense of $9.5bn.
- Internally generated cash mainly financed these investments, as WMT is less dependent on external financing. WMT’s relatively low financial leverage is revealed by their low Debt-to-Equity ratio of only 0.56.
- WMT’s financial strength allowed for shareholder returns in excess of $10bn through dividends ($6.2bn) and share repurchases ($4.1bn).
Financial Modeling for Consumer Products Industry
Financial modeling in the consumer products sector can assist in the decision-making process and can assist with budgeting and management forecasting, cash flow forecasting and product and customer profitability.
How Financial Modeling Can Help Mitigate the Challenges in the Consumer Products Industry
Forecasting demand in FMCG is challenging due to three main reasons:
01
Noise and volatility of demand in the market, the introduction of new products, product promotions.
Performance can be measured regarding forecasting accuracy, forecasting bias, and forecasting stability. For each of these measurements, several metrics exist, and care should be taken to use the most suitable performance metric. Improving forecasting accuracy can lead to a reduction of excess inventory, lower labor costs, lower expedite cost, holding cost, spoilage discount and reduce stock-outs.
02
Complexities in the model are dependent on the quality and quantity of available data, as well as the time available to build and maintain the model.
One must take into account that as complexity increases, the model becomes less easy to understand and maintain, but usually more accurate in representing the situation. Also, the level of uncertainty and the ability to forecast the inputs should affect complexity- the more uncertainty, the less complex model is required since the model is only as good as its inputs.
Types of Financial Modeling Used for Consumer Products Industry
Operational line-items such as Cost of Goods Sold, Sales and Marketing & Distribution costs, etc. are used as inputs in building a balance sheet to predict the future financial performance of a company.
Free cash flow – operating cash flow minus capital expenditure – gives a good measure of company’s future performance
Business Scenarios on Financial Modeling for Consumer Products Industry
Colgate Financial Model Sample –
This case study includes consolidated Income Statement, Balance Sheet, and Cash Flow, as well as Depreciation and Capex, Amortization and Intangible, Working Capital, Other Long-Term Asset Liability Schedule, Shareholder’s Equity, Shares Outstanding and Debt Schedule.
- While the date is unclear, the model contains real data up to 2013 and projections up to 2018.
- Projected Total Net Sales Dec. 2018 – $19,294 Million
- Projected Cash Flow for Financing Activities Dec. 2018 – $2,601 Million.
- Projected Net Working Capital Dec. 2018 – $380 Million
Financial Modeling for Aviation Industry
A data-intensive industry, aviation companies rely on complex financial modeling to determine asset trading strategies, maintenance reserves, financing requirements and other management and accounting reporting requirements.
Challenges in the Aviation Industry and Financial Modeling to the Rescue
A clear understanding of the company’s finances is an absolute must. Additionally, linking the operations to the numbers enables effective management and predictive outcomes.
An accurate and appropriate chart of accounts will give the flight department visibility to run the business in every functional area including Flight Operations, Maintenance, Scheduling, Dispatch, and Administration.
A fleet utilization model will determine the most cost effective means to meet travel demand using all of the methods available.
A realistic capital budget based on travel schedules and cycles will help to determine the requirements for additional aircraft, major maintenance, and upgrades to aircraft systems.
Fuel cost management will modell the retail versus negotiated price to determine potential savings opportunities.
One would need to assess
The credit quality of the issuer.
The strategic value of the aircraft to the operator.
The quality and desirability of aircraft and expected resale value.
The repayment profile and how this compares to the projected depreciation of the underlying debt.
The speed of recourse to the underlying debt, on default.
Types of Financial Modeling Used in the Aviation Industry

Case Studies – Aviation Industry Business Scenarios
Hawaiian Holdings Financial Model Sample
The sample model includes Projected Income Statement, Balance Sheet and Statement of Cash Flow, Revenue Projection, Cost of Capital, Residual Income Valuation, as well as a Comparable Company sheet.

Financial Modeling to Support Data-driven Decision Making
Financial modeling is used by vastly different parties to achieve different goals, including valuation projections, buy or sell ratings and even transactions involving capital structure or ownership. Obtaining financial modeling services from experts has assisted companies in optimizing their financing options to bid competitive prices for PPP projects, and has allowed lenders to evaluate their financing risks.
Financial modeling experts such as Research Optimus can assist companies in developing five-year business plans or giving insight into the feasibility of funding strategies. Utilizing the correct financial modeling techniques can simplify the decision-making process
– Research Optimus
-Research Optimus
 Prev
Prev